Tools and Technologies Used: PageSpeed Insights, Chrome Canary, GitHub Pages, Minifiers, Image Optimizers, HTML5, CSS, and JavaScript
Project for final year of graduation at Delhi University (November 2016 to May 2017)
The term 'Critical Rendering Path' (or CRP), is used to describe the series of steps that a browser takes to render the initial view of a webpage. This project was built upon the knowledge that my team and I gathered while working on its predecessor project (Analysis of Hyper Text Transfer Protocols and its Variants) in which a detailed study of the HTTP Request/Response cycle as well as security and performance advantages of HTTP/2.0 were explored. In this project we specifically focused on strategies that can be used to speed up the process of rendering a page on the viewer's browser.

Purpose Users are accessing the information on the Internet on a wide range of devices through different types of connections, whose speed vary from very slow to lightning fast. The request for resources also arrive from several different geographical locations. All of this complicates the task of high speed delivery of high quality content over the internet. Thus it is imperative for developers and creators of information to follow as well as come up with techniques that increase the performance of their websites and ensure timely and effective access to the information that they want to present. The major purpose of this project was to study and summarize some of the various techniques and good practices that we, as developers can use to build high performance website.
Process In order to optimize the critical resources of a website, we started by studying the steps involved in critical rendering path and the Timeline events (on the Chrome DevTools). Upon focusing on the steps before the render tree construction, we realized that DOM and CSSOM construction are usually the steps that are worst offenders and make the pages render very slowly. If we could optimize these steps, we could achieve the fast rendering. This required an understanding of how the critical resources - HTML, CSS and JavaScript are related to each other since all the three resources depend on each other and affect the way browser will process them, hence affecting the speed of rendering. Details on all of the steps involved in rendering a page and the dependencies between the critical resources are mentioned in the project report.
Once we had clear idea of the CRP and the interdependencies between the resources that make a webpage we started focusing on optimizing the steps that the browser takes before constructing the render tree, which are – the construction of DOM and CSSOM, because these are these are the worst offenders and can make the pages render very slowly. It is important to note that in this project, we didn't dwell on using algorithms with least running time, efficient memory management, or garbage collection techniques. Also, since the strategy of streaming HTML to the client as fast as possible had already been discussed in the previous project they were not covered in this one.
The steps we used to achieve fast rendering rates of our demo website can be broken down into the following three broad categories.
- Minimization, compression and caching of the HTML, CSS, and JS resources
- Minimization of render blocking resources (CSS)
- Minimization of parser blocking resources (JS)
Tools used for measuring and optimizing the CRP As part of the implementation of what we have learnt about the steps that the browser goes through to render the page and the key strategies that are applied to improve the performance of a site, we made a demo website and measured its performance using PageSpeed Insight Tool. We used Chrome Canary (developer version of Chrome) and Chrome Dev Tools to analyze the website. Timeline panel of Chrome Dev Tools gave us a low-level view of what the browser does as it loads a page. We recorded a trace and analyzed all the activities of the website. The different events in the Event Log panel describes the steps that the browser goes through while rendering a page starting from sending a request, processing the response to painting the pixels onto the screen. (The Timeline panel on the previous versions of Chrome Canary has now been replaced by the Performance panel in the latest version which provides the combined functionality of Timeline and JavaScript CPU Profiler panel).
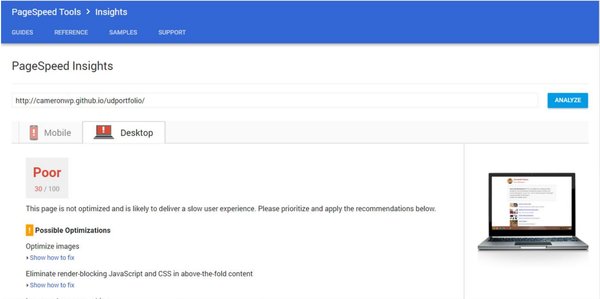
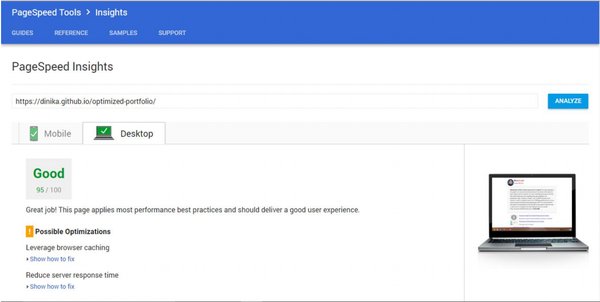
Following the steps outlined above and understanding the CRP metrics, we were able to improve PageSpeed scores of the demo website from 28/100 on mobile devices and 30/100 on desktops to 93/100 and 95/100 respectively
Before Optimization

After Optimization

An important conclusion we arrived at through this project is that we must always measure first and (if need be) optimize second.
Resources